2 Features and Structure of the Display® Poster Generation Tool
The poster generation tool helps you to create your own Display® poster. Having entered all the necessary information it works autonomously and immediately makes available a printable poster in pdf format. It uses a calculation tool that initially determines the buildings’ primary energy consumption. Afterwards the instrument calculates the primary energy ratio, the consumption of primary energy per square metre of the gross internal floor area of the building. According its building type, be it educational, administrative or another kind, the building is graded into a classification scheme of six classes: A to G similar to the well known certification scheme used for household appliances.
Concerning CO2 emissions, the tool performs a near identical procedure. The production, transport, and consumption of every unit of whatever fossil energy source emits a certain amount of greenhouse gas, measured in kg of CO2 equivalents. This unit is utilised so as not to forget the emission of other greenhouse gases. To simplify the term “greenhouse gas emissions measured in kg of CO2 equivalents” in the following sections of this users’ guide the term “CO2 emissions” will be used as an equivalent. Similar to the primary energy consumption, the tool calculates the C02 ratio, the CO2 emissions in kg of C02 equivalents per square metre. Again, this ratio serves as a criterion for the grading of the building into a scheme of seven classes.
Water consumption can be treated in an easier way. The water ratio, the consumption of the building in litres per square metre, is used as a performance indicator. Only for swimming pools, the water performance indicator is based on the water consumption per swimmer because it’s more relevant.
Furthermore, the calculation instrument takes into account the building type when grading the building into one of the six classes. It is obvious that a swimming pool will consume more water!
Starting in the public area of the Display® website it is possible to enter the restricted area by entering your login data. After a successful login, a welcome page with a summary of your contact details and information on your last login will be shown. You have the following possibilities to continue:
 change your contact data on the current page, change your contact data on the current page,
change your password by choosing Your password,
show your logo and change it by clicking on Your logo,
add a building, update or delete your existing building data, and download your poster by selecting Manage building data,
download project documents such as this users’ guide by clicking on Project documents,
enter the Forum to communicate with other participating cities,
get to know all the partners in the E-group.
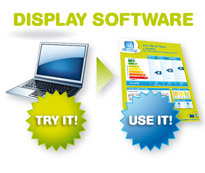
The structure of the Display® website, particularly the poster generation tool, is shown in figure 1.
 - Figure 1: Structure of the Display™ poster generation tool and further parts of the Display™ website
|