ANALYSE YOUR BUILDING DATA
From Display Documentation in English
Within the DATA TREATMENT section of the calculation tool there are three options for the user: Local and National Statistics, Building Statistics Poster, and Import/Export.
Contents |
Local and National statistics
The Local statistics section allows you to compare your own buildings to each other. The National statistics section allows you to see where you fit in nationally.
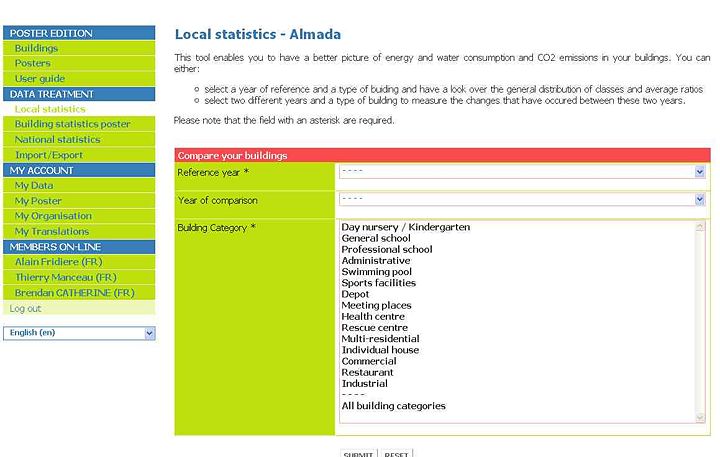
You can choose to see the performance of a specific building type for one year or compare the performance between two different years for the same building. In order to display the general distribution of classes and average ratios for the same year just choose the Reference year from the first drop-down menu shown on the page. Then you have to select the type of building. To compare between different years (which is the aim of Display®) choose a year of comparison. Please note that there is also an option ‘all types of buildings’ if you want to get an overall picture of your building stock. Finally, click on the SUBMIT button at the bottom of the page.
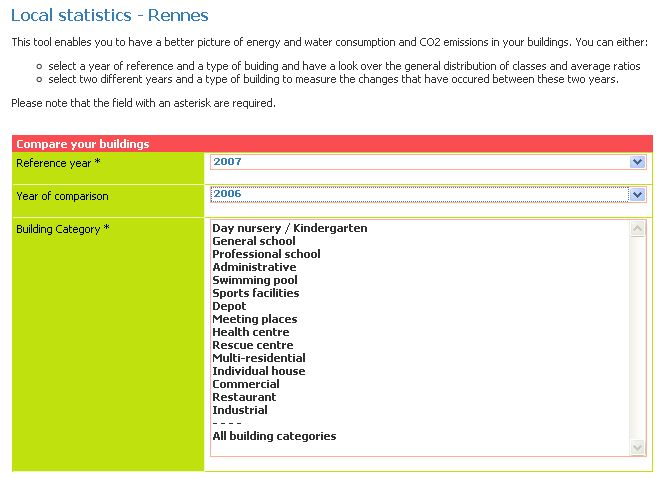
Menu to compare the results between two years
A new page will be uploaded containing the results (tables) for the primary energy, the CO2 emissions and the water consumption for the building type (or all your buildings) and the year(s) selected.
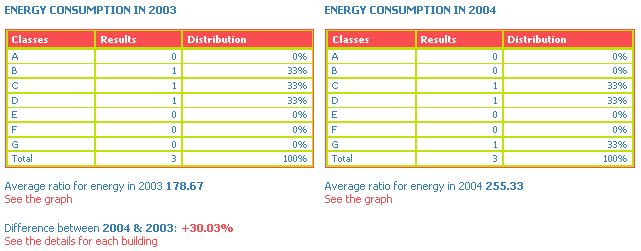
Example of energy consumption comparison table
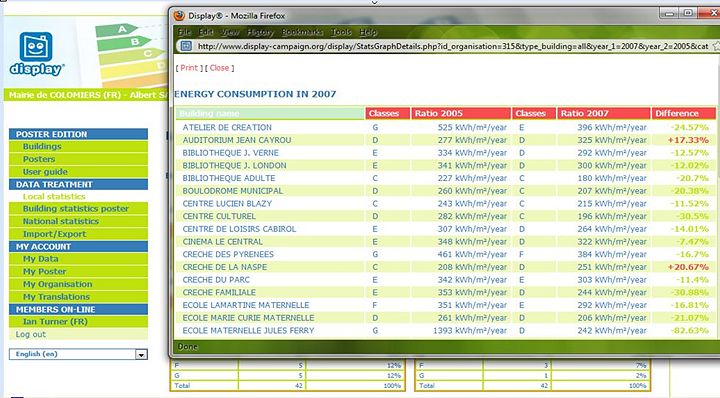
Under the three comparison tables (energy consumption, CO2 emissions and water consumption) is an important link in red See the details for each building which opens a table in a separate window listing each of the buildings, their performance and the classes achieved in the reference year selected. For the local statistics there is additional data on the total Carbon emission for each building and the total by buildings type.
By clicking on the title of each of the columns, you are able to rank the results from biggest to smallest when you click once or visa versa when you click twice. Note that this option see the details for each buildings is not available for the National statistics section.

"see the details for each building" for Energy Consumption
Please note that when you make your selection for the statistics the fields marked with an asterisk are always required!
Building Statistics Poster
The Building statistics poster feature is for local authorities that have carried out technical improvements on their building stock and have the consumption data from many years.
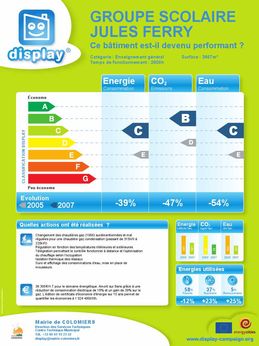
But how?
Click on the Local Statistics to compare your buildings, then add the reference year, the year of comparison, and the building category as shown below:
This feature enables you to compare two different years by clicking on the option See the details for each building. If you click on the title Difference, it will arrange your results from largest to smallest and visa versa.
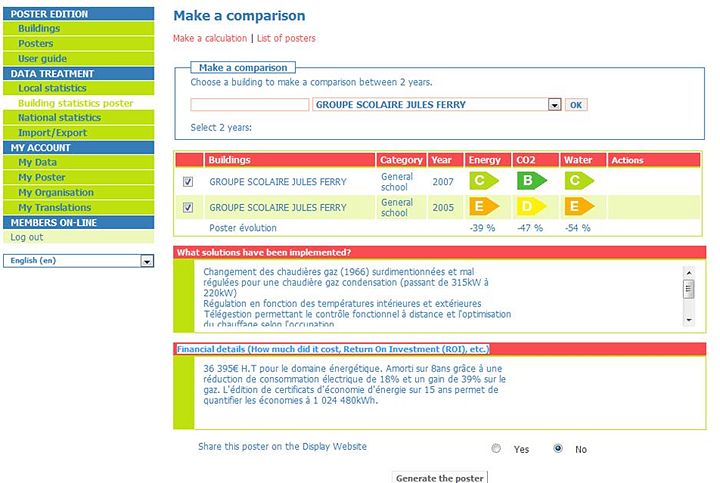
Once you have identified the buildings that you would like to show to the public, go to the Building statistics poster option and choose the building and the two years that you want to compare. Add information about your building on “What solutions have been implemented?” and also “Financial details (Investment, cost savings, Return On Investment (ROI), etc.)”.
Once completed you have an option to share your poster on the Display Website http://www.display-europe.org/cities/posters_en.php. We encourage you to do this as this will stimulate more people to be inspired by the work that is being carried out by Display participants. Your new poster is now available in pdf to print and proudly show to the public showing the multiple years of monitoring.
Import and Export
The Display calculation tool enables all participants to import data and to export them in a spreadsheet format. Importation enables you to make hundreds of calculations at once. Be careful! This function is very powerful but also potentially very dangerous for your data. These manipulations are made at your own risk. You can lose data if you do not use it properly. New users are strongly encouraged to input a few buildings before utilizing the import tool. After having read this page, do not hesitate to contact the Display team if you have any questions.
When using Open Office, we highly recommend:
Open office enables the user to enter data in their native language without losing symbols or hyphenations. Remember to:
- always save your data in .csv format.
- use OpenOffice scalc (www.openoffice.org) as your spreadsheet manager.
- have used Display enough to know it well (at least 20 buildings and 30 calculations entered).
- contact the Display team in case of a problem.
From the Display Website:
The Import/Export system is divided into three parts:
- Import Buildings Data,
- Import Consumption Data,
- Export Data.
How to save your data first:
Please create two directories on your desktop:
- a “save” directory,
- a “work” directory.
In the Import/Export section, just go to “Import Buildings Data”, click on “Spreadsheet for buildings data” and download/save the file in your “save” directory. Please copy this file to your “work” directory. Then, go to “Import Consumption Data” and download the file in your “save” directory. Please copy this file to your “work” directory.
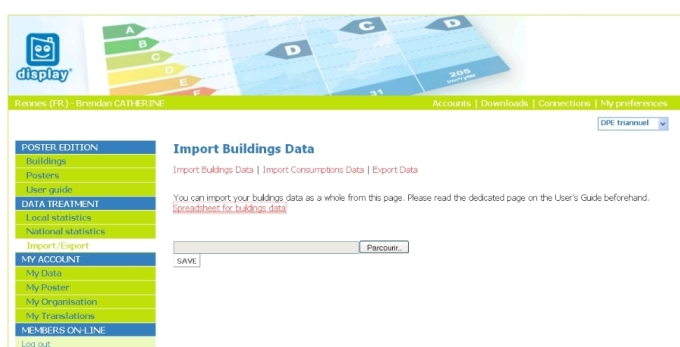
From now on you do not need to use your “save” directory any more. All changes need to be made on your “work” directory. In case you make any serious mistake, you will be able to recover your data from your “save” directory. Please follow these important steps every time you use the Import/Export function.
Import Buildings Data
This section is dedicated to the importation of all data related to buildings (building name, building type, building surface, etc). First of all, go to your “work” directory and open the “Spreadsheet” for buildings data ».
From the Open Office Program:
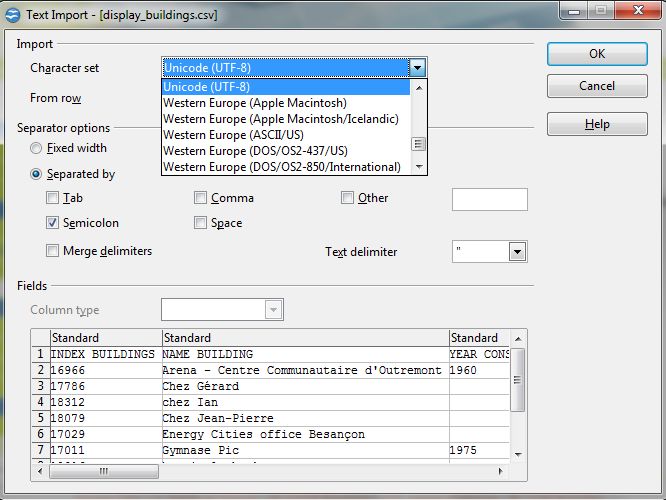
To open the file in Open Office, please select “Unicode UTF-8” for your characters and “Semicolon” as separator. Opening this file, you will see the up to date buildings data entered into Display.
It is obligatory to add the fields ‘Type Building,’ ‘Name of Building,’ and ‘Building Surface.' Please do not touch the columns “INDEX BUILDINGS”. You can update the data in the other columns if you wish. To add new buildings, all you have to do is to make new lines by entering the building name, the building surface and other data related to this building on the line. Please note that you can add dozens of lines if you need to. Below are the definitions of Display data spreadsheet in Open Office:
A. INDEX BUILDINGS: The program will self-generate this item, so it can be left blank! You will later add this generated number in the Building ID section of ‘Input Consumption Data.’
B. NAME BUILDING (Obligatory): The name of the building in your official language as it is directly depicted on the poster. The length of the text should not exceed 30 characters.
C. YEAR CONSTRUCTION: The year in which the building was constructed.
D. REFURBISHMENT LEVEL: The level of refurbishment of a building refers to the current energy condition of the building. There are three levels that you can choose between : low, medium and high:
- Low: (only 1 of the following has been completed in the building: attic insulated, wallsinsulated, heating system has been renewed, lighting has been changed, controlled ventilation system installed).
- Medium: attic insulated plus 2 of the following options: walls insulated, heating system has been renewed, lighting has been changed, controlled ventilation system installed.
- High: complete refurbishment i.e. - attic insulated plus 3 of the following options: walls insulated, heating system has been renewed, lighting has been changed, controlled ventilation system installed).
If you do not know the level of refurbishment (current energy condition) please leave this blank! This choice along with the year of construction are optional and will be used to improve our general data analysis of buildings in Europe.
E. TYPE BUILDING (Obligatory): Choose the appropriate building type from the following list:
- Day nursery / Kindergarten.
- General school (i.e. primary school, secondary school,…).
- Professional school (i.e. hotel and restaurant school, technical college,…).
- Administrative: Public and private administrative buildings, ticket offices, Libraries, museums, cultural centres, information centres, telecom centres, radio/television studio.
- Swimming pool (covered).
- Sports facilities: sports halls, bowling alley, gym/fitness centres, changing rooms, gymnasium, indoor tennis courts.
- Depot: distribution centre, warehouse.
- Meeting places: theatre, live concert hall, cinema, church, funeral hall, community hall, stadium with stands.
- Health centre: hospital, psychiatric clinic, medical centre, rehabilitation centre.
- Rescue centre: fire rescue centre (i.e. fire brigade).
- Multi-residential: flat(either rented or owned)(for privacy reasons, heating and water consumption will be for the whole building, electricity will concern collective use only i.e. lifts and corridor lighting), old-age home, hostel, orphanage, overnight accommodation for the homeless, disabled centre, drug rehabilitation centre, barracks, prison.
- Individual house: detached house or semi-detached house, holiday house.
- Commercial: all types of commercial premises including shopping centres, exhibition centres.
- Restaurant: restaurants (including kitchens), cafeterias, night clubs, canteens.
- Industrial: manufacturers, factories, craft centre, stations, municipal workshop.
- Hospital.
F. BUILDING SURFACE (Obligatory): The gross internal floor area of a building is the area measured to the internal face of the perimeter wall for each floor level. It includes areas occupied by internal walls and partitions, columns, piers and other internal projections, internal balconies, stairwells, toilets, lift lobbies, fire corridors, atria measured at base level only, and covered plant rooms. It excludes the perimeter wall thickness and external projections, external balconies and external fire escapes. Furthermore, unused areas such as unheated cellars or lofts are not included in the gross internal floor area. Its unit is measured in m². If you do not have this exact figure, fill in figure using a slightly different definition of the floor area.
G. HOURS WEEK: The operating hours represents the period when the building works at 100% of its capacity and need to be calculated for the entire year. If the building is opened during 8 hours at 50% of its capacity, then the resulting operating daily hours are 4 hours. This logic needs to be used to calculate the annual operating hours taking into account holidays, weekends etc. Previously the figure required was operating hours per week. All previous data entered has been multiplied by 52 to get an annual figure. We are aware that this figure will not be precise. Please can you check these figures but note that this is a voluntary figure and does not affect your buildings performance.
The columns K. to N. refer to the services provided in the building. If one or several of these services are present in your building, enter the corresponding surface in m².
H. CATERING SERVICES
J. INDUSTRIAL PREMISES
K. SPORTS HALL
L. APARTMENT
M. KINDERGARTEN
N. SWIMMING POOL: The surface of the swimming pool includes the bassin the surrounding area of the pool.
O. SWIMMING SURFACE: This column has to be filled in only if the building is a swimming pool. The swimming surface refers to the surface of the bassin.
Once the changes on this file are done, just save them and go back to the “Import Buildings Data” page. Click the “Browse” button to get the updated file from your “work” directory on your desktop. Then click on the “Save” button.
If the syntax of your file is not valid, the Display software will signal an error by giving the line number and the field where an error occurred. If the file is valid, the Display software will ask you for a confirmation. The data has not yet been entered into the calculation tool. The file has just been checked and uploaded. If you click on “No”, the imported file will be deleted. By clicking on “Yes”, the data will be entered into the system. Previous building data will be updated and new building data will be inserted.
You can go back to your buildings list in the Display software to see all the new data that has been added.
Import Consumption Data
This section is dedicated to the importation of all data related to building consumption (year of reference, water consumption, energy consumptions, etc). Please note that you can only enter building consumption for existing buildings in the Display software. First of all, go to your “work” directory and open the “Spreadsheet for consumptions”. From the Open Office Program:
To open the file in Open Office, please select “Unicode UTF-8” for your characters and “Semicolon” as separator. Opening this file, you will see the buildings data entered into Display up to now. See the above description for “Import Building Data.”
Please do not touch the columns “CONSUMPTION ID”, “ORGANISATION ID” and “CONTACT ID”. You can update the data in the other columns if you wish. To add new building consumption data, all you have to do is to insert new lines by entering the building name, the year of reference, the water consumption, the energy consumptions and other data related to this building on the line. Please note that you can add hundreds of lines if you need to. When you first start we advise to not add more than 50 at a time.
Be careful, the “BUILDING ID” column is very important. If you update already entered data, please do not touch it. If you add new data, you need to insert the building ID in this column. You will find this number in the “Spreadsheet for Buildings Data” you downloaded previously.
From the Display Website:
Once the changes on the Open Office file are done, just save them and go back to the “Import Consumptions Data” page. Click on the “Browse” button to get the updated file in your “work” directory on your desktop. Then click on the “Save” button.
If the syntax of your file is not valid, the Display software will inform you by giving the line number and the field where an error occurred. If the file is valid, the Display software will ask you for confirmation. The data has not yet been entered into the calculation tool. The file has just been checked and uploaded. If you click on “No”, the imported file will be deleted. By clicking on “Yes’“, all data will be entered into the system. Previous consumptions data will be updated and new consumptions data will be inserted.
In the Import/Export section, just go to “Import Consumption Data”, click on “Spreadsheet for Consumption Data” and download/save the file in your “save” directory. Please copy this file to your “work” directory. Below are the definitions of Display data spreadsheet in Open Office:
GENERAL DATA
A. INDEX CONSUMPTIONS: The program will self-generate this item, so it can be left blank!
B. ID BUILDING: Copy the corresponding building ID number for each building you are entering in. This number was generated in the Building Data spreadsheet.
C. NAME BUILDING: The name of the building in your official language as it is directly depicted on the poster. The length of the text should not exceed 30 characters.
D. YEAR: The reference year is the year that you collect the following data.
E. WEATHER: With the goal of harmonising the Display software and increasing the accuracy of your calculations, the weather correction factor is calculated using normalised European statistical data at a regional level from the European statistical institute: Eurostat. If you have more accurate weather data for your region, you can input it manually. Be aware that when writing in the Weather Correction Factor, use commas and not full stops (e.g. 1,06 and not 1.06). You can also input your specific location in the “My Organisation” function and then click “My Weather Correction Factor.” You can update your weather correction factor on this page for your region and all your posters will automatically utilize this data. National organizations should not use this function because they cover many regions and therefore they will have multiple climatic conditions.
F. WATER: Note down the water consumption of your building in the reference year. The required unit is m3. You also have the option to enter data in litres and Gallons. These figures will be converted into m3 by the calculation tool.
ENERGY CONSUMPTION
The data related to your energy consumption have to be filled in columns G. to AS..
UNIT: All the data have to be filled in kWh, except from District heating where the unit is MWh.
In columns G. to I., enter the annual consumption of gas regarding the different uses; if you do not know the allocation of your gas consumption, go to J..
Energy source
|
| On the same way as for gas, please fill in the following columns. Each time:
|
K. to N.: FUEL
It is assumed that light fuel oil is used.
O. to R.: COAL - In column AU.:
- Enter 1 for anthracite.
- Enter 2 for brown coal.
S. to V.: DISTRICT HEATING
W. to Z.: WOOD - In column AV.:
- Enter 1 for logs.
- Enter 2 for chips.
- Enter 3 for pellets.
AA. to AD.: THERMAL SOLAR
This line concerns the non-electrical energy production by a solar collector, e.g. for hot water.
AE. to AI.: CONVENTIONAL ELECTRICITY
This line takes into account electricity that is purchased with supply contracts that do not contain an agreement about the contribution of specific primary energy sources to the overall energy mix.
The column AH. ("Others") refers to electric equipment and lighting.
AJ. to AN.: GREEN ELECTRICITY
By default the calculation instrument assumes that wind power and hydro energy each contribute 50 % to the overall energy mix since both are the most frequently used renewable energy sources for the production of electricity.
The column AM. ("Others") refers to electric equipment and lighting.
AO. to AS.: SOLAR ENERGY
This line concerns the electricity production using photovoltaic (PV) cells. You do not need to specify the type of your photovoltaic cells as the calculation instruments assumes that the system consists of polycrystalline silicon.
- If you sell all the electricity that you produce: you have to specify here your PV electricity production (kWh). In addition, you must subtract the energy produced by the PV panels from your real electricity use (kWh on your electricity bill), then put that amount in the “conventional electricity purchased”.
Example: your photovoltaic cells produce 10 000 kWh and your electricity bill is 15 000 kWh. You have to put 10 000 kWh i n the “Photovoltaics” category and 5 000 kWh (= 15 000 – 10 000) in the appropriate electricity (conventional or green) category.
- If you only sell the surplus you are only required to enter your electricity consumption.
DISTRICT HEATING
If you have district heating, please fill in columns AW., AX., AZ., BI. and BJ..
Columns AW. and AX. give individual specification of the district heating network.
AW.: DISTRICT PRIMARY FACTOR
Enter the cumulative energy use factor.
Unit: kWh/kWh.
AX.: DISTRICT CO2 FACTOR
Enter the CO2 emission factor for your district heating network.
Unit: kg/kWh.
AZ.: COGENERATION
Enter 1 if a cogeneration plant is used.
Columns BI. and BJ. refer to the energy sources used for the district heating. The figure should be a percentage.
BI.: DISTRICT HEATING FOSSIL
BJ.: DISTRICT HEATING RENEWABLES
DISTRIBUTION OF THE CONSUMED CONVENTIONAL ELECTRICITY
Fill in columns BD. to BH. only if you know the consumed convetional electricity and if it is different from the national one.
BD.: ELECTRICITY PRIMARY FACTOR
Unit: kWh/kWh.
BE.: ELECTRICITY CO2 FACTOR
Unit: kg/kWh.
The mix of national electricity production will be used by default. If the supply contract specifies a contribution of specific primary energy sources to the overall energy mix, please enter the data columns BF. to BH.. The figure should be a percentage.
BF.: FOSSIL LOCAL
BG.: NUCLEAR LOCAL
BH.: RENEWABLE LOCAL
COGENERATION UNIT
You need to fill in columns BA. to BC. if you have a cogeneration unit.
BA.: PRODUCED
Insert the electricity production of the unit that was not consumed within your building. Unit: kWh.
BB.: FED
Insert fed into the grid. Unit: kWh.
BC.: COGENERATION PLANT ENERGY
- Enter 1 if natural gas.
- Enter 2 if fuel oil.
- Enter 3 if biogas.
ACTIONS AND SOLUTIONS
BK.: ACTIONS
Provide her information on “simple actions” to improve the environmental or energetic performance of the building.
Please write a short sentence providing information on “simple actions” to improve the environmental or energetic performance of the building. Be aware that the introduction text [“YOU can help reduce the energy and water consumption in this building today by 10 % or more! Please use energy in a sensible way:”] is identical for each poster and since the space is limited please do not write more than three simple actions and do not exceed a text length of about 100 characters for each action. The text can be allocated to two lines.
BL.: SOLUTIONS
Provide here information on technical solutions to improve the environmental or energetic performance of the building.
If you have already implemented or if you plan certain measures to improve the environmental or energetic performance of the building, please describe them in a short paragraph. For buildings that have already achieved class A in a certain category this text box allows you to underline these outstanding results and the measures that have been undertaken to achieve this classification. Since space is limited do not write more than three technical solutions and do not exceed a text length of 100 characters. In the case that you do not enter any text, a blank area will be left in the corresponding place on the poster.
Once you have filled in the Spreadsheet for consumptions, please go "Import Consumptions Data" in the "Import/Export" section of the online Display software. Click the “Browse” button to get the updated file from your “work” directory. Then click on the “Save” button.
You can then go back to your posters list in the Display software to see all your new poster calculations.
Export Data
From this section, you can find:
- the “Spreadsheet for buildings data” usable in the data importation system,
- the “Spreadsheet for consumptions” usable in the data importation system,
- all your results with the Display software up to now.
The “Spreadsheet for data and calculations” option will enable you to download both the building and calculation data in one spreadsheet allowing you to analyse them for further reports and presentations in your organisation.
