|
The online software, a core element of the Display® Campaign, is currently available in the majority of the official European languages. Once you have registered your buildings you can with a few clicks edit a Poster and compare performances using the local or national statistics options and provide data and graphs for your energy management reports.
Quicklinks :
 1. Approach and Methodology 1. Approach and Methodology
2. Software Guide
1. Approach and Methodology
The Display calculation tool determines the primary energy, carbon dioxide equivalents and water consumption performance indicators using the so-called “operational rating scheme”. Display pilot cities opted for this scheme because :
- Final energy consumption data can be easily obtained ; and
- Operational rating certificates can be updated yearly and therefore also act as a measure of quality of the management and used to motivate the building - caretakers and users.
The first step for all Display® Campaign participants is to collect simple baseline data and feed this into the Display® calculation tool. Data requirements include readily available information such as :
- Annual consumption for lighting and equipment in kWh
- Annual heating and hot water consumption in kWh
- Annual water consumption in m3
Try ans see for yourself :
Asset rating vs operational rating
The calculation methodology for Asset rating is based on the characteristics of a building and its installed equipment for lighting, ventilation and air-conditioning assuming standard conditions for occupancy, climate, environment and use.
Operational rating is based on metered energy consumption which includes energy uses for all purposes and in actual conditions.
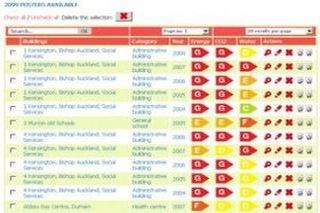
Compare and display annual consumption and carbon data
The statistics section of the calculation tool allows each Display® user to compare the energy, and water use for their building stock by year and compare the total carbon emission of their buildings.
2. Software Guide
Please find the current version of the Display User’s Guide for the calculation tool on the publicly available wiki currently available in English, French, German and Hungarian. It will lead you through the online calculation tool and explain its different sections.
|


 What commitments do members enter into ?